How AEO Transforms Your Approach to Website Analytics
For years I worked with clients who had beautiful websites that performed poorly. They invested in design, maybe some SEO, and then hoped for the best. But hope is not a strategy. The real shift happened when I started treating analytics not as a report to file away but as a live conversation with the visitor. That is where AEO comes in. It stands for Analytics Experience Optimization, a methodology that blends quantitative data from tools like Google Analytics with qualitative insights from heatmaps and session recordings. The goal is not more data but better decisions.
Why Traditional Analytics Falls Short
Most business owners look at Google Analytics and see a dashboard full of numbers. Sessions, pageviews, bounce rate, average time on page. They click around, get overwhelmed, and close the tab. The problem is not the data. It is the lack of context. A high bounce rate might mean your content is off, or it might mean a visitor found exactly what they needed on one page and left satisfied. Raw numbers cannot tell you which is which.
This is where AEO changes the game. It asks you to move beyond the dashboard and into the visitor's experience. Instead of asking "How many people visited?" you start asking "What did they come looking for, and did they find it?" That shift in perspective makes every other tool more useful.
Building a Data-First Culture Without the Noise
When I first started using Google Analytics, I made the classic mistake of tracking everything. Page views, event tracking, custom dimensions. The result was a mess of reports that took hours to untangle. Over time I learned that less is more. The most effective analytics setups focus on a handful of key performance indicators directly tied to business goals. For an ecommerce site, that might be conversion rate and average order value. For a content site, time on page and click-through rate on calls to action matter more.
But numbers alone cannot tell you why something is happening. That is why I pair Google Analytics with tools like Hotjar and Crazy Egg. Hotjar gives you session recordings and heatmaps. You can watch a visitor scroll through a landing page and see exactly where they hesitate or where they click. Crazy Egg offers similar functionality with a focus on A/B testing. Together they form a feedback loop: the quantitative tells you what happened, the qualitative tells you why.
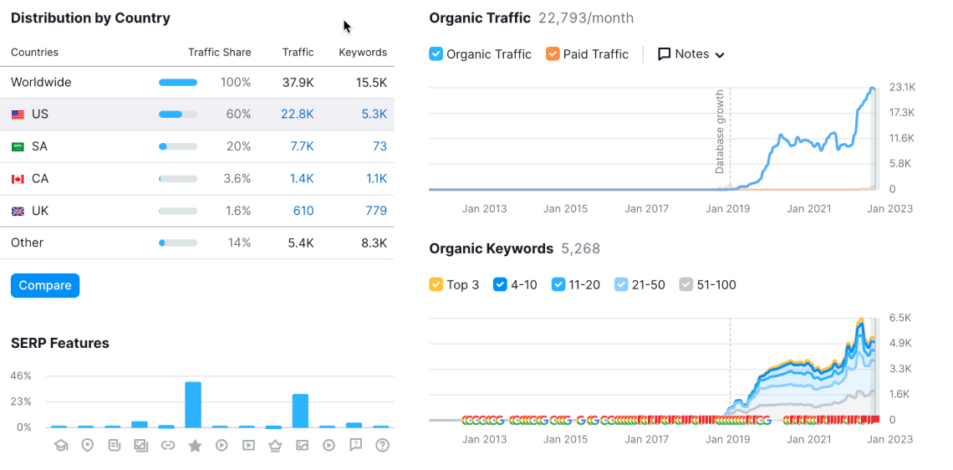
For example, I worked with a Shopify store that had a high bounce rate on their product pages. Google Analytics showed the bounce rate was over 70 percent. The numbers said people were leaving. Hotjar recordings showed that visitors were clicking the "Add to Cart" button but then not completing the purchase. The button was too small on mobile, and the checkout process had too many steps. A simple redesign of the button and a streamlined checkout flow reduced the bounce rate by 20 points and increased sales by 15 percent. That insight came from combining tools, not from any single metric.
Practical Steps to Implement AEO
Start with your analytics platform. Google Analytics is still the industry standard, but it requires thoughtful configuration. Set up goals that mirror real conversions: a completed purchase, a form submission, a click on a specific call to action. Use Google Tag Manager to manage your tracking codes without editing the site code every time. This keeps your data clean and your team agile.
Next, bring in qualitative tools. Hotjar is my go-to for session recordings because it is easy to set up and does not overwhelm you with data. Watch recordings of users who converted and users who did not. Look for patterns. Maybe people who read the entire FAQ page are more likely to buy. Maybe a particular headline causes confusion. These observations become hypotheses you can test with A/B testing tools like Optimizely.
Optimizely is built for running experiments. You can change a headline, a button color, or the layout of a landing page and see which version performs better. A/B testing takes the guesswork out of optimization. But it only works if you have a clear question and enough traffic to reach statistical significance. That is where the analytics-first mindset helps. You do not test random things. You test what the data suggests is worth testing.
Another tool in this stack is Google Search Console. It tells you which search queries bring people to your site and how often your pages appear in search results. Combined with Google Analytics, you can see which keywords lead to actual conversions, not just clicks. This closes the loop between SEO and user experience. If you attract the right people but lose them on the site, the problem is not the traffic. It is the experience.
Common Mistakes and How to Avoid Them
One mistake I see frequently is relying on a single tool for everything. For instance, someone might use only Google Analytics and assume that a high time on page means engagement. But a visitor could leave the tab open while making coffee. Session recordings from Hotjar would catch that. Another mistake is ignoring the mobile experience. Most traffic comes from mobile devices now, yet many analytics setups still default to desktop views. Always segment your data by device.

Another pitfall is setting up too many events and goals. I have seen clients create fifty custom goals in Google Analytics and then wonder why none of them feel actionable. Stick to three to five core metrics that matter to your business. For most companies, those are conversion rate, average order value, bounce rate by page, and click-through rate on primary calls to action. Everything else is noise.
I also recommend using a tool like Moz or SEMrush for competitive analysis. These platforms show you how your site compares to competitors in terms of keyword rankings, backlinks, and site authority. While not directly part of AEO, they help you understand the context of your traffic. If your bounce rate is high but your competitors' is low, that is a red flag worth investigating.
Bringing It All Together With a Central Platform
If you work with multiple clients or manage a large site, consider a central analytics platform like HubSpot. HubSpot integrates with Google Analytics, Google Search Console, WordPress, and Shopify, pulling data into one dashboard. It also offers its own tools for SEO, email marketing, and CRM. This reduces the need to jump between platforms and makes it easier to connect marketing efforts to revenue.
But even with a central platform, the principle of AEO remains the same. Start with a clear question. Look at the numbers. Validate with qualitative observations. Test your hypothesis. Then implement the winning version and monitor the results. This cycle turns analytics from a report into a lever for growth.
For example, a client of mine runs a WordPress blog that generates leads for their consulting business. They used Google Analytics to see that the blog had a high click-through rate on internal links but a low conversion rate on the final call to action. Hotjar recordings showed that visitors were interested in the content but found the call to action button buried at the bottom of long articles. Moving the call to action higher and making it more visible increased conversions by 30 percent. The insight came from combining quantitative data with qualitative observation - the core of AEO.
Another client uses Shopify for their online store. They noticed through Google Analytics that a specific product page had a low click-through rate to the cart. Using Crazy Egg, they ran an A/B test on the product images and the button text. The winning combination increased click-through rate by 22 percent. Without the structured approach of AEO, they might have redesigned the entire page and missed the simple fix.

Final Thoughts on Making Analytics Work for You
Analytics is not a one-time setup. It is an ongoing practice. The tools change, the platforms update, and your audience's behavior shifts. What worked last year might not work this year. The methodology of AEO - ask, measure, observe, test, implement - stays relevant because it is about how you think, not which software you use.
If you are just starting, pick one tool and get comfortable with it. Google Analytics is the obvious starting point. Add one qualitative tool, like Hotjar, and one testing tool, like Optimizely. Run your first experiment. It does not have to be perfect. The goal is to build the habit of using data to make decisions. Over time, you will develop intuition for what the numbers mean and when to dig deeper.
I have seen small businesses transform their online performance simply by shifting from a passive reporting mindset to an active optimization one. They stopped asking "How many visitors?" and started asking "What do they need and how can we give it to them faster?" That is the power of AEO. It turns data into direction.